Nanoparticle Sizing for Regulatory Compliance and Product Development
Accurately determine the size and distribution of nanoparticles in your products with Cormica’s reliable nanoparticle sizing services. Our expertise in Dynamic Light Scattering (DLS) and Nanoparticle Tracking Analysis (NTA) ensures precise results critical for product optimization and regulatory compliance.
Why and when is nanoparticle sizing important?
- Optimizing product functionality: Particle size influences the performance of many products, including medicines, cosmetics, and advanced materials.
- Ensuring regulatory compliance: Regulatory bodies like ECHA and EFSA require comprehensive nanoparticle characterisation for product registration.
- Understanding product safety: The health and environmental effects of nanomaterials depend on their size, making accurate sizing crucial.
Why Cormica?
- Technical expertise: Our team has in-depth knowledge of nanoparticle sizing techniques, interpreting results to address your specific applications.
- Regulatory familiarity: We have extensive experience working with ECHA, EFSA, and ISO standards.rovide tailored data solutions.
- Flexibility: We advise on the best technique (DLS, NTA, or a combination) for your unique sample characteristics.
- Client-focused: We provide clear explanations of our results and tailor our services to meet your individual needs.
Overview of Nanoparticle Sizing
Nanomaterials are typically defined as ‘chemical substances with particle sizes between 1 to 100 nanometres in at least one dimension’ [1]
There are a number of reasons that nanoparticle sizing may be of interest and importance.
In some applications, particle size affects the functionality of a product, therefore optimising and measuring the particle size is key to improving the efficacy of, for example, certain medicines or treatments.
Secondly, the health effects of nanomaterials on the human body have not been fully explored. As a result, regulatory bodies such as ECHA (European Chemicals Agency) and EFSA (European Food Safety Authority) provide very specific guidelines for registering products containing any proportion of nanomaterials. This can include aggregates which themselves may be much larger in size but are formed from particles which meet the definition of a nanoparticle. Particle sizing is a vital component of these regulatory submissions.
Two techniques used regularly at Cormica Bradford for nanoparticle sizing are dynamic light scattering and nanoparticle tracking analysis. These will be the focus here, but there are other options for nanoparticle sizing at Cormica including resonant mass measurements using the Malvern Panalytical Archimedes (more suited to sub-micron particles in the hundreds of nanometres range), plus scanning and transmission electron microscopy.
Dynamic Light Scattering (DLS)
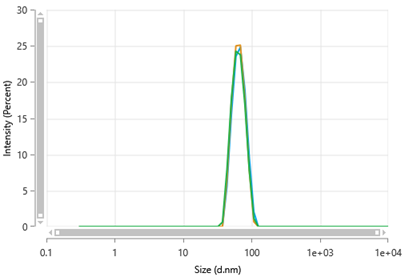
Nanoparticles in suspension undergo Brownian motion (random motion due to interactions with the surrounding solvent molecules), the speed of which is directly related to the particle size. During Dynamic Light Scattering (DLS), a laser beam passing through the suspension is scattered by the nanoparticles at given intensities. As the particles diffuse via Brownian motion, this causes variations in the scattered light intensity over time which can be measured by the detector. A correlator function is used to analyse these variations and determine the Brownian motion of the particles which can then be used to calculate a particle size distribution based on the particle size which best fits the correlation function. At Cormica Bradford, DLS testing is carried out using the Malvern Panalytical Zetasizer Ultra. An example output from the instrument is presented in Figure 1.


Nanoparticle Tracking Analysis (NTA)
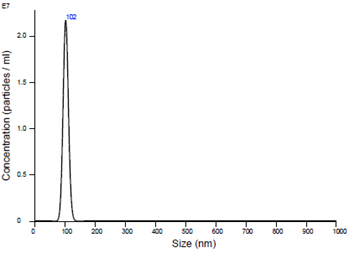
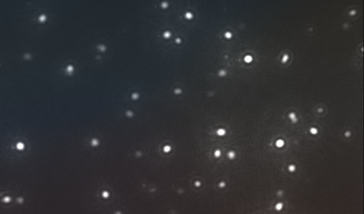
Nanoparticle Tracking Analysis (NTA) also makes use of the Brownian motion of nanoparticles but uses a different method of transforming this into a size distribution. Individual particles are tracked using a camera capable of detecting the light scattered by the particle, and the Brownian motion is measured. The Stokes-Einstein equation is then used to calculate the particle size of each particle, and by measuring a large number of particles, a size distribution is generated. At Cormica Bradford, NTA testing is carried out using the Malvern Panalytical NanoSight NS300. An example output from this instrument is presented in Figure 2.

Compare & Contrast – the right instrument for the job
In an ideal case of perfectly monodisperse, spherical nanoparticles, the two techniques would be expected to give very similar results. However, the majority of real-world samples are not this simple, and every sample has its own particular set of characteristics. Choosing the right technique can be critical in correctly and completely understanding sample composition. Comparing DLS and NTA analysis, different performance strengths can be observed for the two techniques:Technical Specifications
-
-
-
- DLS can detect a broad size range of particle sizes. In the case of the Malvern Panalytical Zetasizer Ultra, particles around 1 nm can be detected ranging up to around 10 µm. In comparison, NTA focuses more narrowly around the 30nm to 1 micron range.
- DLS is ideal when sample quantity is very limited, with minimum sample requirements in the microlitres per measurement, compared to the NTA where the required volume is still low, but closer to 1 mL per analysis.
- NTA can detect a much lower concentration of particles, with the optimal concentration range 106-109 particles/mL, while DLS has a wider concentration range at around 108-1018 particles/mL.
- For non-aqueous samples, DLS is able to handle a range of buffers, while NTA is generally suited to buffers of water-like viscosity.
- NTA also allows a degree of visualisation of the sample via videos of the scattered light from each particle (although not images of the particles themselves) and their motion over time
- Both instruments have rapid measurement times, typically around 5-15 minutes per replicate.
-
-
Regulatory considerations for Nanoparticles
-
-
-
- When working to ISO standards, ISO22412:2017 specifies the use of dynamic light scattering, in which case the clear choice is a DLS instrument over an NTA instrument.
- In the case of some regulatory submissions, such as the European REACH regulations, number-based distributions with details of the number fraction of nanoparticles is required. With NTA analysis where particles are individually tracked, the resultant size distribution is by default a number-based distribution, compared to DLS which is an intensity-based distribution, therefore NTA results automatically meet the regulatory requirements.
-
-
Sample and application considerations
-
-
-
- For routine or repeat batch analysis where average particle size and polydispersity are the parameters of most interest, DLS analyses the scattering signal from a far higher number of particles on a shorter timescale than NTA and so is typically the more appropriate choice.
- The broad concentration range available for DLS means that this may be preferred for samples where dilution would be a problem e.g. destabilisation of a complex formulation, while NTA is preferred for samples which are expected to contain lower particle concentrations.
- As NTA analyses individual particles, it can be useful for more polydisperse samples where a clearer distinction between peaks of similar particle sizes is required. The higher resolution of the NTA can result in increased detail across the distribution where the DLS results would present a single broad peak.
- As DLS is a non-invasive technique, aggregation studies can be carried out by repeat analysis of the same sample over extended periods of time. Changes in the particle size distribution and/or appearance of additional peaks over repeat measurements are a good indicator of a changing sample population.
-
-
A combined approach to Nanoparticle Sizing
As discussed above, the applications of DLS and NTA analysis range from simple particle size and concentration analysis through to aggregation and stability studies. However, in some cases, a single nanometric technique may not be sufficient to fully characterise a sample. For more complex samples, two complementary techniques may be required to obtain a complete picture.
This is particularly true for multiple populations within a single sample. In these cases, DLS can provide a broad overview of the sample, while NTA provides detail in particular peaks. Because DLS is a non-invasive technique, samples can be recovered from the DLS and the same aliquot analysed by NTA if required, so the two measurements can be carried out without the need for additional sample material where availability is more limited.
For example, in the case of a low concentration of larger particles within a sample of highly concentrated, much smaller primary particle size, e.g. 100nm agglomerates with primary particles below 10 nm, the DLS can be used to determine the particle size and concentration of the primary peak which is too small to be detected via NTA, while the NTA can be used to track the size and concentration of aggregates which is too low a concentration for the DLS.
Conclusions
Nanoparticle sizing is a key component of product development and analysis throughout a range of industry sectors, from pharmaceuticals to food products, agrochemicals and more complex advanced materials. Choosing the right technique(s) allows for the best understanding of the nature and behaviour of every sample.
References [1] https://echa.europa.eu/regulations/nanomaterials


